Lab 9 - Surfaces: Accuracy of DEMs


Specifically, for our lab we used Spatial Analyst Extraction tools in ArcGIS, as well as a handful of formulas in Excel to derive accuracy metrics for a DEM, while noting any differences between land cover types. My numerical results are shown in the table below.
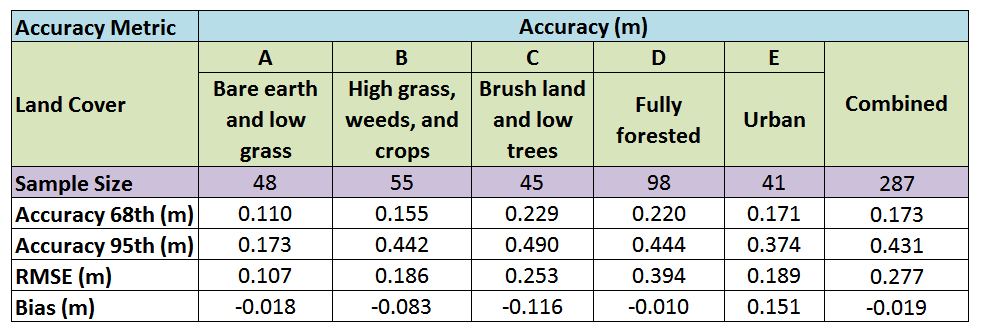
When measuring error, smaller values are better and/or that values closer to zero are better. Based on the results in the table, it can be noted that Land Cover A (Bare Earth and Low Grass) has the highest RSME accuracy, while Land Cover D (Fully Forested) has the lowest RSME accuracy. However, when introducing bias information, we we are shown that Land Cover D (Fully Forested) has the highest accuracy, while Land Cover E (Urban) has the lowest accuracy. Since we can see both positive and negative values, we know that the LiDAR data has over- and under-estimated the reference values. This is a way for an analyst to calculate whether the accuracy of LiDAR data is biased or not.
Comments
Post a Comment