Lab 13 - Effects of Resolution (Scale) in Raster Data
In the context of GIS, scale has many meanings. When working with raster data, scale is expressed as "resolution" or cell size dimension representing the area covered on the ground. (Esri, Zandbergen)
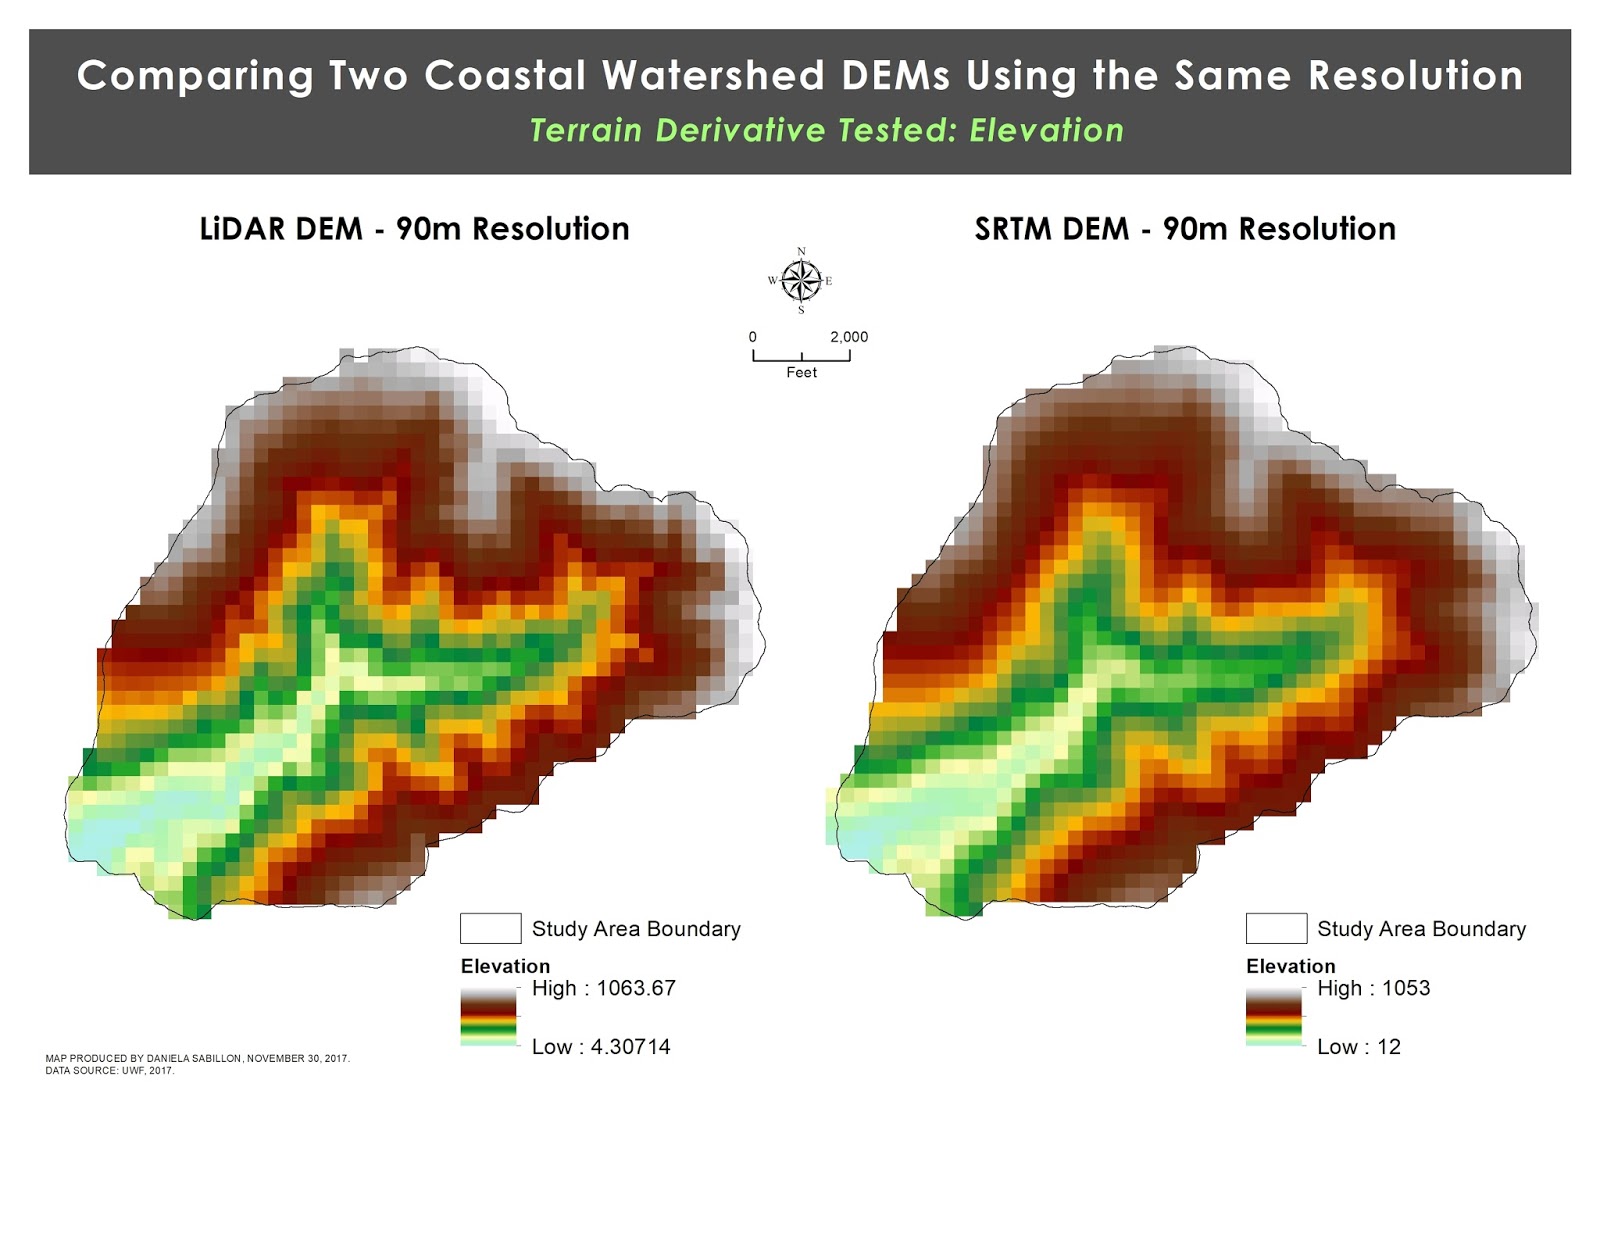
In a portion of this week's lab assignment, we compared two coastal watershed DEMs in California at the same resolution. I compared my two
DEMs using various techniques in terms of elevation values, as well as first
order and combined derivatives.
Specifically, I determined the average slope for each raster, as well as aspect
and curvature using the appropriate tools in Spatial Analyst; and also
illustrated the difference in minimum and maximum elevation values. Slope
represents steepness; aspect shows the direction the downhill slope faces for
each location; and curvature is calculated for each raster surface. See my map comparisons below.


Even though both
DEMs were projected to the exact same coordinate system and resampled to the exact
same 90 m resolution, all the derivatives tested indicate the effects that scale
has in raster data creation. Beginning with elevation values, the average
difference between maximum and minimum values of the DEMs is 9 points. In
regards to slope, the average slope for the LiDAR DEM is 31.33, while the average
slope for the SRTM DEM is 29.19. By default, aspect is affected in all areas of
the watershed since it takes into account the direction of the downhill slope.
And finally, curvature is the most visually appalling as we can notice that
curvature values are non-continuous and scattered in the LiDAR DEM in
comparison to the SRTM DEM. I believe these differences stem from the
acquisition of elevation sample points which amount to the accuracy of cell
size resolution.
Comments
Post a Comment