Lab 1 - GIS Management Overview & Program Development
Whoaa... this first lab assignment in my GIS 6555 GIS Management class was lots of work! To keep things concise, I'm only going to share 2 of the deliverables -- both of which were very eye-opening.
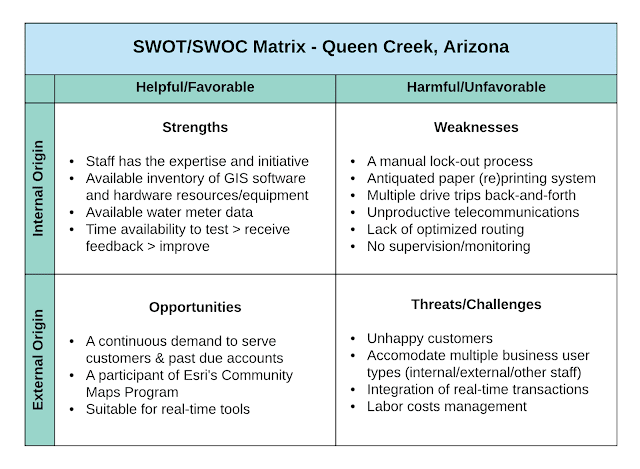
The SWOT Analysis
Yup, we were tasked to create the infamous SWOT/SWOC matrix-styled table identifying the strengths, weaknesses, opportunities, and threats/challenges representing the case study "GIS Speeds Water Service Restoration" (Esri, 2015) at the town of Queen Creek, Arizona before they improved their processes. Along with my matrix, I also described the characteristics and explained how the elements were instrumental in contributing to the solutions implemented. However, I am not inserting that here because it was about 700 words long (ha).
Flowcharts and Business Processes
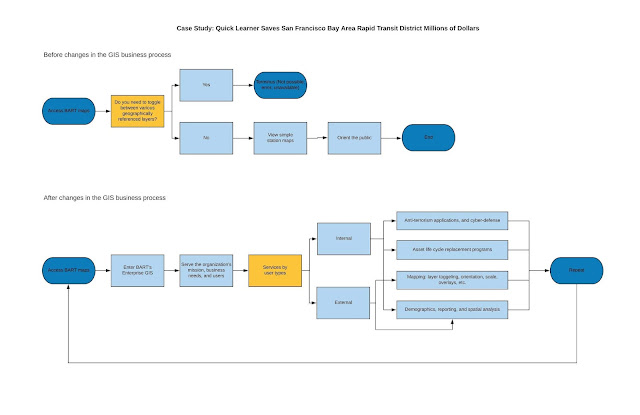
Another really cool lab deliverable involved the creation (and some really intense critical-thinking) of a total of 4 flowcharts (using Lucidchart) to model business processes before and after of these two case studies: "Quick Learner Saves San Francisco Bay Area Rapid Transit District Millions of Dollars" (Esri, 2014) and "Ball Field Study Hits Home Run" (Esri, 2015).
Following direction from the article entitled “Five Tips for Better Flowcharts” by SmartDraw (2019), I created my flowcharts utilizing a left-to-right alignment, kept everything on one page, used a different color to denote decisions (instead of diamond-shapes), made sure the return/repeat lines were placed under the diagram, and used split-paths when applicable. All of these design choices are best practiced principles to facilitate the understanding of business processes.
References
Croswell, P. L. (2009). The GIS
management handbook: Concepts, practices, and tools for planning, implementing,
and managing geographic information system projects and programs.
Frankfort, KY: Kessey Dewitt Publications.
Esri. (2014). Quick Learner Saves
San Francisco Bay Area Rapid Transit District Millions of Dollars. ArcNews, Winter 2013/2014, 35(4). Retrieved from
https://www.esri.com/esri-news/arcnews/winter1314articles/quick-learner-saves-san-francisco-bay-area-rapid-transit-district-millions-of-dollars
Esri. (2015). GIS speeds water
service restoration. ArcNews, Fall 2015, 37(3). Retrieved from
https://www.esri.com/esri-news/arcnews/fall15articles/gis-speeds-water-service-restoration
Morgan, J.D. (2018, November 30). GIS Program Development [Video
file]. Retrieved from https://www.youtube.com/watch?v=DaooMQHJeps&feature=youtu.be
Peterson, D. & Marshall, C. (2015).
Ball
Field Study Hits Home Run. ArcNews,
Spring 2015, 37(1). Retrieved from https://www.esri.com/esri-news/arcnews/spring15articles/ball-field-study-hits-home-run
SmartDraw. (2019). Five tips for better flowcharts. Retrieved from
https://www.smartdraw.com/flowchart/flowchart-tips.htm


Comments
Post a Comment