Module 11 - 3D Mapping
After this week's lesson, it seems like the future of cartography is heading towards 3D mapping. Why? Well, quite simply: real life is already 3-dimensional, it's not flat, so why not make our maps that way too? Our world is full of natural and man-made features with all kinds of heights and depths -- from buildings to mountains, to caves and wells. As stated in an Esri White Paper titled 3D Urban Mapping: From Pretty Pictures to 3D GIS, "If done correctly, the transition to 3D urban mapping will extend the value, investment, and life span of existing 2D GIS data."
As with anything, there always exist disadvantages. But let's discuss the pros first. 3D mapping is evolving to become a forefront in the GIS/mapping industry because of its ability to give audiences a true perspective of the world. 3D mapping allows us to delve into the waters of a platform and swim up and down, and all around the high and lows of a scene. Nothing is hidden, nothing is misinterpreted, making depth and height perception easier to understand. Because of this new way of looking at things, it gives leverage to both public and private consumers when attempting to plan urbanization, market goods, or for line-of-sight emergency analysis in public safety and natural disasters (like flood modeling).
The cons about 3D mapping are more like challenges and areas for improvement: design techniques have limited use due to lack of spatial accuracy or photo-realistic detail, arbitrary methods in feature symbolization, and the deriving of elevation data (not to mention the cost).
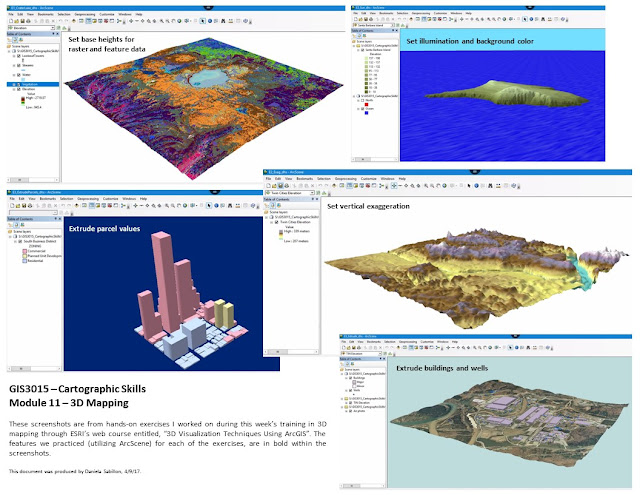
In this week's lab assignment, we got a really exciting training through Esri's web course entitled "3D Visualization Techniques Using ArcGIS", where we experimented using GIS data in a 3-dimensional environment using ArcScene and ArcGIS 3D Analyst. As you can see from my image above, we practiced some major feature configurations:
- Setting base heights for raster and feature data: Did you know that all of our regular 2D data can be displayed in 3D, as long as we have a raster or TIN (Triangulated Irregular Network) surface layer? In this exercise we achieved this by making sure all the data was in the same extent; we also turned on shading, and chose appropriate symbology.
- Setting illumination and background color: Applying illumination to a scene involves adjusting values under the Azimuth, Altitude, and Contrast feature options under Scene Properties. Lighting and shading effects are an important part of seeing features in a realistic manner in 3D; therefore, it's important to change the sun's position and angle when examining different areas in a scene.
- Setting vertical exaggeration: Vertical exaggeration gives terrain a more dynamic appearance. When we set a vertical exaggeration value, it does so for all layers equally, making it a scene property, rather than an individual layer property. Vertical exaggeration is only a visual effect; it doesn't change the z-values in the data.
- Extruding features such as buildings and wells: Extruding is the method of projecting 2-dimensional data in a 3-dimensional environment. In our exercise, we extruded building and well features, which rose above and below our TIN layer.
- Extruding attributes of land parcels based on their cost value: Extrusion can also be used to visualize other attributes, such as land parcels based on their cost value. In this exercise we configured settings so that the z-values represented money, rather than height.

Comments
Post a Comment