Week 4 - GIS Hardware, Software, and Programming & Sharing GIS Maps and Data
This week was another great, absorbing experience. We began by learning important requirements and considerations of hardware to maximize the great capacities of a geographic information system software. For example, one of the most important things to consider when wanting to work with a GIS, is making sure that your laptop or desktop obtains a high-speed central processing unit (CPU). Other vital considerations include "bigger, better, and faster" Read Only Memory (ROM), Random Access Memory (RAM), operating system (OS), and screen resolution.
We also learned about commercial GIS software: ArcGIS and Manifold; open source GIS software: GRASS, QGIS, GeoDa, and DIVA-GIS; and remote sensing software: IDRISI, IMAGINE, and ENVI. Another topic included GIS programming: python, ArcPy, and ArcObjects -- and their incredible power to increase productivity. I am especially interested in this area of automation because I know this is where I want to end up in the GIS industry.
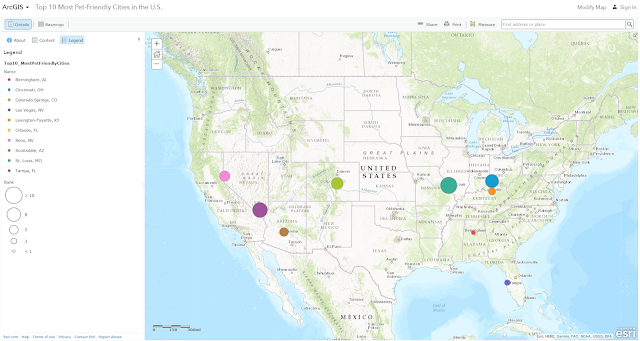
For our lab assignment, we learned how to acquire data, create maps, and share them publicly with the world. There are many ways to achieve these things, but we used ArcGIS Online, the Map Package feature via ArcGIS Desktop, and Google Earth. Using all methods was a good experience because it allowed us to note characteristics, limitations, and positive/negative aspects of each. We were tasked to choose a top 10 list of our liking. After a quick Google search, I decided to use the top 10 most pet-friendly cities in the U.S., based on a 2016 WalletHub article authored by Richie Bernardo (read the article by clicking here). With the information provided in the article, I created data in an Excel table, then brought it into ArcGIS Online to be geocoded by the World Geocoder Service, which then allowed me to create a web map and configure Symbology settings through the user-interace. Then, through the connection mechanisms already established in ArcGIS products, we brought this data into ArcGIS Desktop, to then be "Shared As" a Map Package. And finally, we used a Geoprocessing Conversion Tool to create a .KMZ file to be used and shared via Google Earth.
The screenshot below is my ArcGIS Online Web Map entitled "Top 10 Most Pet-Friendly Cities in the U.S.". You can access it by clicking here.
And the screenshot below displays the same data using Google Earth.


Comments
Post a Comment