Lab 3 - Data Quality: Assessment
This week we continued determining the quality of road networks, but this time by comparing "completeness" between two street datasets in Jackson County, Oregon. Although there isn't a standardize NSSDA (National Standards for Spatial Data Accuracy) protocol in determining such a metric, for our lab assignment we used a similar methodology to one discussed in one of our readings by Mordechai Haklay (2010).
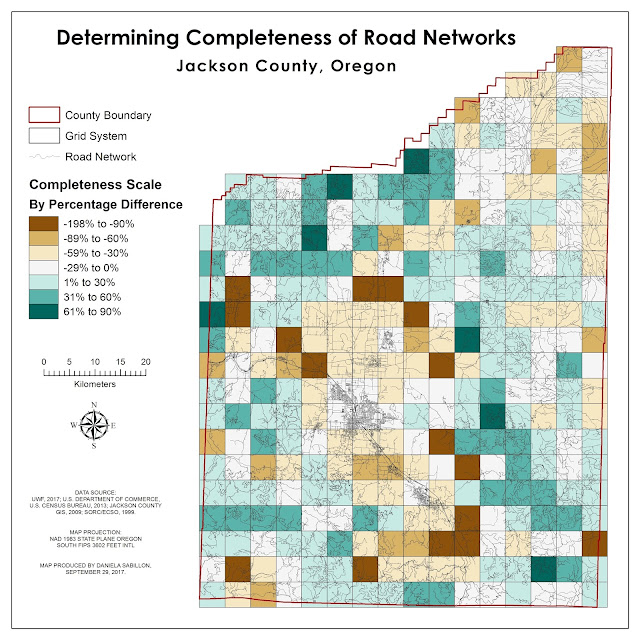
The goal of the accuracy assessment is to visually and numerically compare a summary of differences between two sets of streets (TIGER Roads vs. Jackson County Street Centerlines) by grid polygons (size 1 km x 1 km), as well as at a county boundary level, to depict completeness. Ultimately, we wanted to answer the following questions: 1. For how many of the grid polygons are the Street Centerlines more complete than the TIGER Roads, and 2. For how many of the grid polygons are the TIGER Roads more complete than the Street Centerlines? My final map product is shown below.
At the county boundary level, the analysis methodology is simple because it is assumed that "more roads means more complete". This was quickly attained by calculating the length using the Calculate Geometry tool. TIGER Roads won by 577 km.
At the grid polygon level, the analysis methodology involved more steps. Specifically, I used the following ArcGIS tools: Intersect, Summarize, and Table Join; as well as a series of formulas in Excel.

Nice post.
ReplyDeleteml model performance monitoring
ml model monitoring
machine learning monitoring tools
ml monitoring on azure
data quality on azure
data quality on aws
data quality monitoring tools
piperr
Awesome article keep sharing your valuable thoughts like this
ReplyDeletepayroll software
visitor management software
mobile app development
mobile app development company
android app development company
ios app development company
vehicle tracking software
fleet management software