Module 4 - Visibility Analysis (Viewshed and Line Of Sight)
Visibility Analysis is used in many different applications, such as: scenic quality, sound reduction, urban design, civil and military observation needs, telecommunications, planning, and more. There are two basic principles of visibility analysis: viewshed and line of sight. The question that viewshed analysis attempts to answer is: Which areas in a landscape are visible from an observer point? And the question that line of sight analysis attempts to answer is: Which segments are visible along a specific line?
In ArcGIS, visibility analysis is relatively simple to execute using the extension toolboxes of Spatial Analyst and 3D Analyst; the two main data components needed are a DEM (Digital Elevation Model), and observer points. For our lab assignment, we conducted visibility analysis for various scenarios, broken down into four parts. This was a very fun and interesting module. See below for specifics.
Part A - Basic Visibility Analysis
In Part A, we conducted a viewshed analysis from potential tower sites (point data) placed on summits on a DEM, to determine how much can be seen from these locations. The tools we used to conduct this analysis included: Viewshed, Observer Points, and Extract Values to Points (found under Spatial Analyst > Surface and > Extraction). By using these tools, we created two different outputs: a viewshed raster and an observer raster. The cell values of the viewshed raster represent the frequency of how many times an observer point can be seen from each surface area location. While the cell values of the observer raster identify exactly which observer points are visible from each raster surface location. The observer raster output uses a binary-coding system to record the frequency associated with the observation point(s).
Part B - More Detailed Visibility Analysis
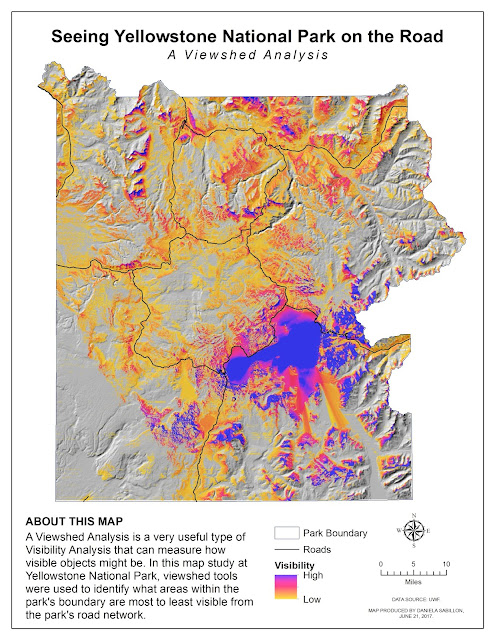
In Part B, we also performed a viewshed analysis, but this time using a road network (polyline data) as observer points on a DEM of Yellowstone National Park, to determine what areas of the park are the most and least visible from the roads. My final map product is shown below.
Aside from the tools we used in Part A, some additional tools we used in Part B included Hillshade and Extract by Mask, also found under Spatial Analyst > Surface and > Extraction.
Part C - Site Surveillance Location Using Line Of Sight Analysis

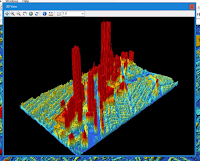
In Part C, we examined visibility at a more micro level: the finish line of the Boston Marathon. We first conducted viewshed analysis from potential camera location placements, and then examined the data to determine best placement for optimal coverage in a line of sight. Aside from the Spatial Analyst tools we used in Part A and B, in Part C we also used 3D Analyst's LAS Dataset toolbar and Visibility tool (specifically trying out different Horizontal Start and End Angles under the Observer Parameters options). Additionally, we converted our LiDAR data to Raster using the Conversion tool > LAS Dataset to Raster. Based on the LiDAR data, and by using the LAS Dataset 3D View button to view the streetscape in 3D (see screenshot on the left), I determined where to place my two additional cameras.
As you can see from the screenshot on the left, I placed one camera diagonally to the northeast across the original camera, and the second one was placed directly across to the northwest from the original camera as well. Based on the LiDAR elevation symbology, I gave the northeast camera an offset value of 120, and the northwest camera an offset value of 110. The viewing angle for all 3 cameras was made at a 45 to 135 degree direction/rotation.
As you can see from the screenshot on the left, I placed one camera diagonally to the northeast across the original camera, and the second one was placed directly across to the northwest from the original camera as well. Based on the LiDAR elevation symbology, I gave the northeast camera an offset value of 120, and the northwest camera an offset value of 110. The viewing angle for all 3 cameras was made at a 45 to 135 degree direction/rotation.
Part D - Line Of Sight Analysis
And finally, in Part D we furthermore examined another example of Line Of Sight analysis using summit point data as our observer points, placed on a DEM. We used 3D Analyst's toolbar, as well as these following tools from the toolbox: Profile Graph, Create Line Of Sight, Construct Sight Lines, and Line Of Sight.
The screenshot below shows a Profile Graph based on a line of sight I created manually by clicking on an observer point and then on a target point (using the Create Line Of Sight tool). The Profile Graph provided me with details of an Obstruction Point. Knowing about these types of obstruction points can be very useful information for instance if one is planning to construct a structure that would require a clear, visible sight line.
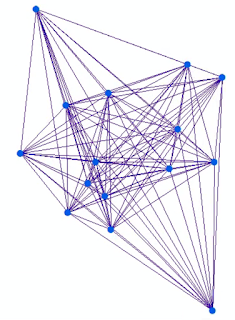
The screenshot below is an output from using the Construct Sight Lines tool from our observer points data. For every point data, it creates all possible sight lines.
Lastly, the screenshot below depicts the output from using the Line Of Sight tool. The output from this tool creates more records, each record representing a segment portion, broken down into two categories, visible and invisible.


Comments
Post a Comment