Lab 6 - Interpolation in PostGIS
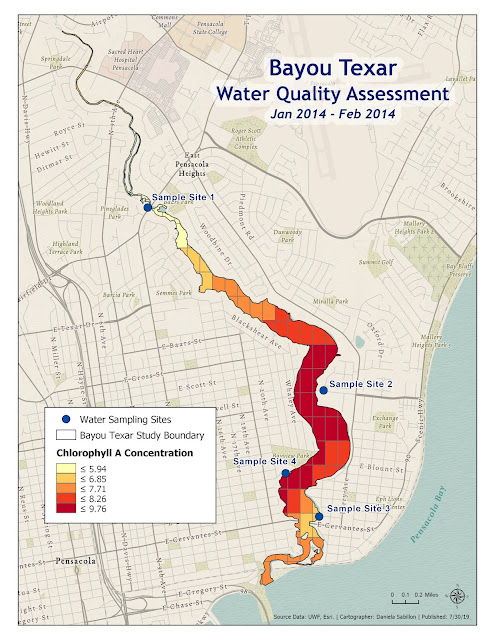
This lab is basically Lab 5, but improved (lol). Notice the symbology on the tessellated surface?


Challenges encountered in this lab:
- In Deliverable #1, I encountered some challenges when attempting to run the simple UNION and subselects SQL. I couldn’t figure out what I was doing wrong, but had a gut feeling that maybe it had to with some syntax issue (the ones that drive you nuts). Sure enough, after reading through a few forums and troubleshooting using the Error Code as my keywords in Google, I learned that because I capitalized the “J” and the “F” in Lab 5 when I created the jan14 and feb14 tables from the .csv’s, my SQL statement was failing. To fix this, I had to put double quotations before and after the table name and schema, like so: SELECT * FROM “btwq”.“Jan14”.
- While going through the sequence of steps in the lab, I came to the realization that I understand spatial queries best when I can spatially visualize them, too. For example, a lot of the queries we ran in Postgres would typically create a few outputs in ArcGIS Pro/Map. Seeing the results spatially on a map, or manually selecting tables to Join or Relate to, based on common column names using ArcGIS interface tools makes me understand the process better. It’s like a child playing with blocks – the physical-ness of it makes me get it, does that make sense? In Postgres, the tabular views weren’t enough for me, and reading SQL statements backwards to understand the process is still quite intimidating. I overcame this challenge by spending time with my ERD and reading my relationships out loud, that really helped. Also, after running each query, I would immediately go to ArcGIS Pro to see what changed, this also helped me better understand the SQL statements.
- I am not the biggest fan of ArcGIS Pro for map-making. Though it provides some of the coolest Base Maps, has neat 3D capabilities, it’s quick in processing tools and calculations, etc. – I believe it is not as user-friendly as ArcMap for ultimate map customization. Some of the features I feel are lacking in ease of use include: specific zooming windows, converting text/labels to annotation, and permanent grid lines that one can lock to. I could have produced the same mapping product in ¼ of the time in ArcMap (then again, I’ve been using ArcMap for 5+ years – but still). I overcame this challenge by forcing myself to have patience.
On another note, here's my ERD for this exercise and an explanation of my relationship choices:

- Each sample site has at least one water sample measurement -to many water sample measurements. But each water sample measurement belongs to only one unique sample site.
- Bayou Texar has 4 sample sites (many). The sample sites belong to one and only one Bayou Texar.
- The water sample measurements are associated to one water of body, Bayou Texar. Bayou Texar has various water sample measurement attributes associated to it.
- The Bayou Texar grid is contained within the one and only one Bayou Texar geographic boundary. Bayou Texar has one and only one fishnet grid.
- The water sample measurements are estimated in at least one -to many grids based on proximity. Each grid in the Bayou Texar fishnet grid has a least one -to many, estimated values based from the water sample measurement data.
Comments
Post a Comment