Lab 1 - Wireframing Web Maps
wire·frame
/ˈwī(ə)rˌfrām/
a visual guide that represents the skeletal framework of a website.
'Wireframing web maps' is the first topic of GIS 6110 Advanced Topics in GIS for an important reason: "cartographers are well-positioned to take on the role of user experience (UX) designers on mapping and GIS projects" (Morgan, 2018; Roth et. al, 2017). As such, since this class entails designing and building web mapping applications, our first lab assignment involved create both a low-fidelity and high-fidelity wireframes for a proposed Web GIS of my choice. A low-fidelity wireframe provides a rough sketch of the proposed interaction solution, while a high-fidelity wireframe illustrates the proposed representation solution using real-data (Roth et. al, 2017).
In her YouTube video, Bonifant (2012) explains the 3 main reasons why wireframing is important:
- To establish hierarchy of information
- Simplify communication
- Serve as a blueprint
Intended purpose: Simplify the
application process for construction firms in submitting required documents to
Osceola County to obtain permits – which depends exactly on where the construction is taking place.
Using filters in the form of a checklist, the process within a Web GIS could save
construction firms lots of money and time.
Intended audience: Anyone
that is interested in constructing (or altering the construction of) a
structure on or below land (for example: commercial buildings, residences,
roads, driveways, sewers, etc.). Usually general contractors, civil engineering
companies, environmental agencies, etc., but also regular citizens wanting to
do improvements on their house lot.
Data proposed: GIS layers from municipalities,
counties, and state governments; also, utility information, conservation
sensitive areas, and more. These would be in the form of polygons, polylines,
and points.
Example URLs:https://forwarn.forestthreats.org/fcav2/https://www.zillow.com/homes/for_rent/Orlando-FL/townhouse_type/13121_rid/28.781502https://fdot.maps.arcgis.com/apps/PublicInformation/index.html?appid=4925ff239fe24a9e92e1caa510e100b2https://fdot.maps.arcgis.com/apps/webappviewer/index.html?id=1868cc8e50ee4ceb8844f4ec6132a8c4
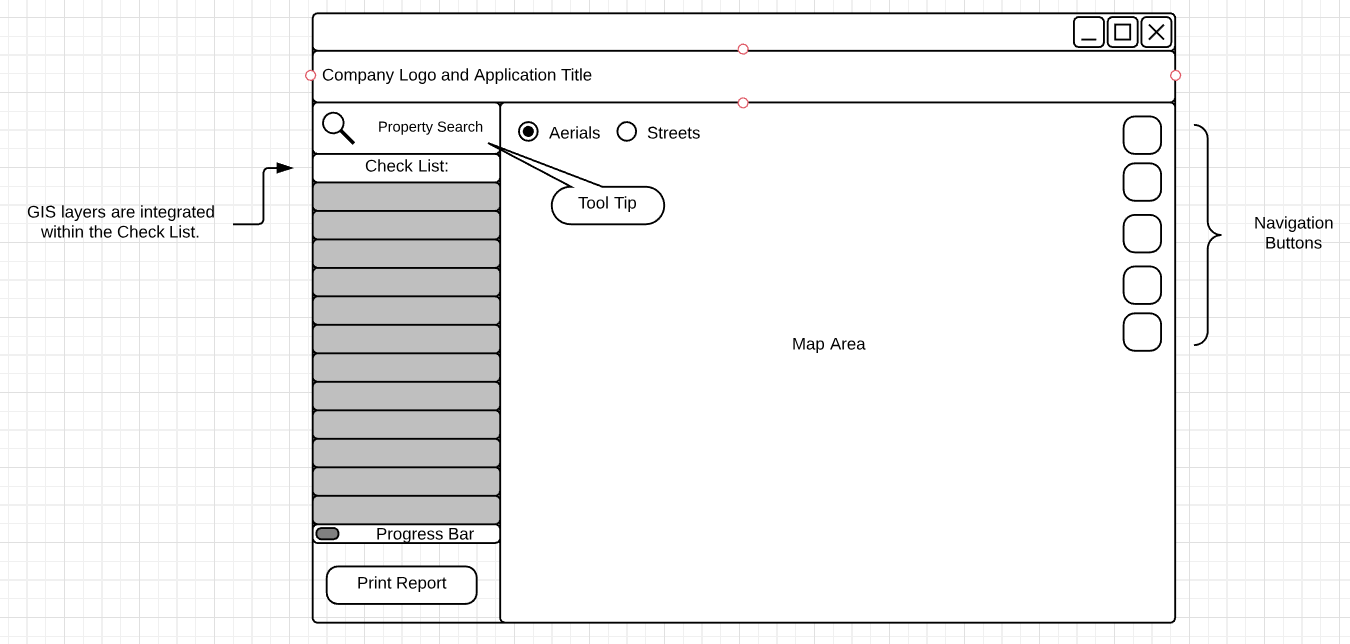
My low-fidelity wireframe
Bonifant (2012) describes a wireframe as a basic visual representation of a website before any kind of development takes place, specifically, without any colors, shading, fonts, or other design elements—just “the most important pieces outlined in boxes and shapes, but only in grayscale”. My low-fidelity wireframe follows just that: it’s all in grayscale and focuses on the layout and location of important interactive components (for example: navigation buttons, optional base map views, search button to get started, logo and title locations, and the GIS layers/checklist bar). These are the most essential elements in their simplest forms of my proposed Web GIS outlined in boxes.
My high-fidelity
wireframe provides more detail to the functionality of my proposed Web GIS,
using sample data. My sample data includes Transportation GIS layers that
follow checklist items within Osceola County’s Land Development Code (which explains
standards that must be illustrated in submittal documents/plans for review). For
example, if a property falls within a certain distance of any of those GIS
layers under the Transportation category, strict guidelines must be followed to
receive approval from multiple jurisdictions. I also included specific
navigation buttons (home, your location, pan hand, zoom in, and zoom out icons),
as well as created a mockup illustration using aerial imagery in a busy area of
the county using ArcMap.
Lastly, before
creating either of my wireframes, I followed Lucidchart’s suggestions of 1.
“identifying site needs”, 2. “rating the importance of each element on a page”,
and 3. “considering how visitors will interact with it”. Though a lot of the
visitors may be used to web mapping applications, from personal experience,
there are always many that don’t. All users should be remembered when
considering “utility” and “usability” of an application.

References
Bonifant, K. (2012). What is a Wireframe?
Retrieved from https://www.youtube.com/watch?v=T0vt3nLZKks&feature=youtu.be.
Lucidchart. How to make a wireframe.
Retrieved from https://www.lucidchart.com/pages/how-to-make-awireframe.
Roth, R. E., Hart, D., Mead, R., &
Quinn, C. (2017). Wireframing for interactive & web-based geographic
visualization: designing the NOAA Lake Level Viewer. Cartography and Geographic
Information Science, 44(4), 338-357.
Comments
Post a Comment